This site uses cookies to improve your experience. To help us insure we adhere to various privacy regulations, please select your country/region of residence. If you do not select a country, we will assume you are from the United States. Select your Cookie Settings or view our Privacy Policy and Terms of Use.
Cookie Settings
Cookies and similar technologies are used on this website for proper function of the website, for tracking performance analytics and for marketing purposes. We and some of our third-party providers may use cookie data for various purposes. Please review the cookie settings below and choose your preference.
Used for the proper function of the website
Used for monitoring website traffic and interactions
Cookie Settings
Cookies and similar technologies are used on this website for proper function of the website, for tracking performance analytics and for marketing purposes. We and some of our third-party providers may use cookie data for various purposes. Please review the cookie settings below and choose your preference.
Strictly Necessary: Used for the proper function of the website
Performance/Analytics: Used for monitoring website traffic and interactions
10 Conversion Rate Strategies to Test for the 2021 Holiday Season. Last year, the eCommerce conversion rate for Black Friday was only 2.3% — a significant drop from 2019’s rate of 5.13%. Our clients typically experience traffic increases during the holidays, such as this 100,000 sessions increase at the start of December 2019.
Due to shoppers’ tendency to form their opinion based on their first exposure to the website, web design is the area where no expense (within reason) should be spared to make your website look as professional as possible. While competing on price is an option, it’s self-destructive and eats into your profit margin.
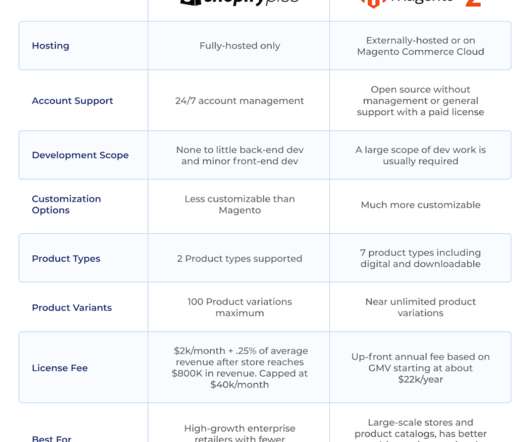
Flat pricing of $2,000 per month for retailers with less than $9.6m The tradeoff here is a wider range of capabilities with more work, cost, and often a longer development timeline. Shopify Plus vs Magento Pricing Comparison. As a result, their pricing varies considerably. Shopify Plus Costs. in yearly sales.
Last month , we learned about Google Marketing Live 2019 , the anniversary of GDPR , the latest trends in social media, and more. This month, we’ll be diving into IRCE 2019 , exciting campaigns we saw in June, and recent innovative augmented reality (AR) use cases. ROI Revolution attended IRCE 2019 and had a blast!
We'll briefly explore who they are, their pros and cons, prices, and who they're best suited for. In October 2019, Shopify surpassed over one million merchants across the globe! How Much Does Shopify Cost? Check out our Shopify review and Shopify pricing guide for more info. Does that sound good to you?
Editor’s note: This article was originally published in 2019. So, how can you optimize your checkout process to make that sale and simultaneously increase your average order value (AOV)? Or, if you’d like a custom conversion strategy for your online business, we’re always happy to chat. Show final pricing in the cart.
Need an intelligent way to update your conversion strategies? Justuno is an advanced marketing solution that offers state-of-the-art intelligence on your customer's conversion journeys. Justuno: Pricing. Once you've decided that the service is right for you, pricing starts at around $25 per month. Even better?
less than 2020, ecommerce sales rose an estimated 45% compared to 2019. Take a look at our top Black Friday Cyber Monday strategies so you can boost conversions and reach your goals this season. Not having a strategy in place for Black Friday and Cyber Monday can cost retailers thousands of dollars in missed revenue.
Need an intelligent way to update your conversion strategies? Justuno is an advanced marketing solution that offers state-of-the-art intelligence on your customer's conversion journeys. Justuno: Pricing. Once you've decided that the service is right for you, pricing starts at around $25 per month. Even better?
Optimize For Mobile Mobile spending in the US has more than doubled compared to 2019, so there’s no debate that your store needs to be optimized for mobile purchases. Offer Free Shipping or Discounts Extra checkout costs are the number one reason why shoppers abandon their carts, outside of just browsing.
In addition to depending on their ecommerce sales to supplement their brick-and-mortar losses, many luxury brands are cutting capital expenses and dividends. From Q4 2019 to Q1 2020, video streaming platform Twitch exceeded three billion hours watched for the first time ever. Automotive, shipping, & travel.
The lack of free shipping stops many shoppers from purchasing. In a survey published at the end of 2019, 68% of over 1,000 U.S. online shoppers said that they didn’t make a purchase more than half of the time if the brand didn’t offer free shipping. Almost a quarter of shoppers would spend more to access free shipping.
This method of personalization focuses most on increasing average session duration, product engagement, and customer conversion rate. Let’s walk through the four most effective ways you can optimize your website: Offers : Customize the product itself, the price, or the supporting visuals. Product Recommendations.
42% of marketers say interpreting results is the biggest challenge in conversionoptimization. is the average conversion rate for websites viewed on tablets, versus 1.9% It's seven times more expensive to get a new customer than retain an existing one. 55% of companies have a mobile-optimized website, mobile app, or both.
Ecommerce order volume has increased by 50% compared to 2019. This surge, combined with disrupted supply chains, has led to an increase in shipping delays, as well. Amazon reopens shipping for nonessential items. Amazon has announced that they’re reopening their shipping services for nonessential items. Find it here.
These credits will be given to SMBs that have been active since January 2019. The loans, backed by the Small Business Association, can be used to pay for basic expenses. Conversionoptimization during COVID-19. The maps on this site compare the pollution levels between March 2019 and March 2020. 3/31 update.
Coronavirus is also expected to impact back-to-school and holiday shopping , with consumers across all income brackets saying they expect to spend less during these seasonal times than in 2019. ecommerce in 2018 and just over 40% in 2019, Walmart has seen 74% YOY growth so far in 2020. Uncommon Goods rainbow face coverings.
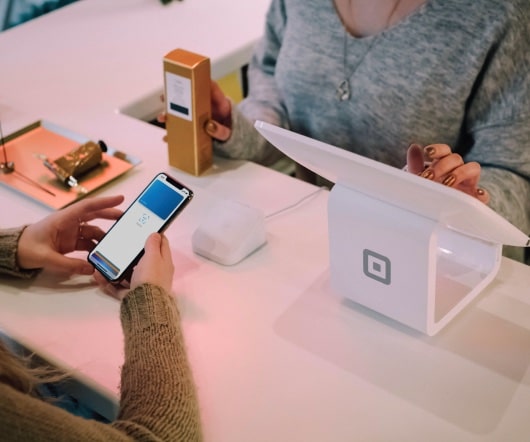
It quickly grew from a $415M event to more than $7B in 2019. adults spend on social networks was expected to plateau in 2020 and 2021 after doing the same in 2018 and 2019. The concept of Walmart’s touch-free payment system is very similar to Apple Pay, which saw users increase from 67 million in 2016 to 441 million in 2019.
This is a slowdown from Cyber Monday 2019‘s online sales growth , which jumped 19.7% trillion in 2019 to $1.3 trillion in 2020, with B2B marketplace gross merchandise volume growing from $16.58B in 2018 to $22.56B in 2019 to $31.19B in 2020. In 2019, time spent with social networks fell by 1.3%. year-over-year to hit $9.4
increase over 2019. In June 2021, ecommerce was up 95% over June 2019. Conversely, grocery saw the smallest YoY sales growth, with the furniture & furnishings sector declining 5.3%. Every category was up over 2019 except for lodging, which declined 2.5%. billion in 2019. billion in 2019 and a whopping 148.2%
Shipping, inventory, and fulfillment are the basic underpinnings of a business that must work flawlessly for marketing & advertising to be worth it – and they are all in flux right now. Last year, low prices and the ability to purchase online were the top concerns for customers. Business being good isn’t always a good thing.
BOPIS also brings consumers the immediate satisfaction of receiving their item almost immediately without having to search for it in the store or wait for it to be shipped. From 2018 to 2019, ecommerce sales grew just 12.7%. This equates to a 59% month-over-month increase in August compared to July. 9/14 update. 8/28 update.
In 2019, time spent with social networks fell by 1.3%. billion (+45.2%) over Prime Day 2019 and from $4.19 BOPIS also brings consumers the immediate satisfaction of receiving their item almost immediately without having to search for it in the store or wait for it to be shipped. of adult internet users already on social media.
While this isn’t as pronounced of an increase as we saw in 2020 from 2019 ($600.1B), marketers and executives should note that these are levels of ecommerce that experts didn’t expect we would reach until 2024. In 2019, ecommerce grew 14.6% This is a slowdown from Cyber Monday 2019‘s online sales growth , which jumped 19.7%
From 2018 to 2019, ecommerce sales grew just 12.7%. In this video replay , our ecommerce experts pinpoint online strategies that are here to stay, top considerations to keep in mind as you plan for the unprecedented, and how you can still leverage your 2019 data to forecast for the holidays. Department stores accounted for 14.3%
In 2019, spend was just $55.9 are seeing customers be less willing to pay full price. are seeing customers be less willing to pay full price. of digital ad revenue share in 2020, down from 37% in 2019 in light of Amazon’s significant increase. billion, up from just 50 billion in 2019. April 27 update. of all U.S.
Free delivery, availability, and price were the top three key online purchase drivers for this group of consumers. And now it’s been pushed back again to give time for the marketplace giant to get all its shipping and fulfillment ducks in a row, including the hiring of more than 175,000 new workers. 7/29 update. 7/9 update. 7/9 update.
Shipping, inventory, and fulfillment are the basic underpinnings of a business that must work flawlessly for marketing & advertising to be worth it – and they are all in flux right now. For comparison, in 2019, ecommerce sales made up just 11.1% billion in 2019. billion in 2019 but is only expected to hit $3.74
While consumers enjoy BNPL for its ease of use, flexibility, and low interest rates, 57% say they regret using BNPL because it was too expensive. billion in 2019 and a whopping 148.2% The pandemic potentially hindered growth last year, with Prime Day sales surging a significant 71% in 2019. In 2019, spend was just $55.9
In 2019, spend was just $55.9 are seeing customers be less willing to pay full price. are seeing customers be less willing to pay full price. of digital ad revenue share in 2020, down from 37% in 2019 in light of Amazon’s significant increase. billion, up from just 50 billion in 2019. April 27 update. of all U.S.
What started as factory shutdowns has snowballed into issues across the entire supply chain, from material and labor shortages to increased freight prices to extremely delayed shipping. Rising costs are making it even more difficult for businesses to get their products delivered to stores and customers alike. How did it happen?
in 2019 ( eMarketer ). US adult social media users spent 7 more minutes per day on social media in 2020 than 2019 – total of 82 minutes. YouTube ad revenue grew to $6.89B in Q4 2020 from $4.72B in Q4 2019 as the pandemic fueled video growth. That’s a 15% year-over-year increase , up from 6 hours and 49 minutes in 2019.
However, the fashion category as a whole saw some steep declines in 2020, with the global fashion industry’s profit expected to have fallen 93% in 2020 after rising 4% in 2019. That’s almost double the growth that was seen from 2019 to 2020, with the pandemic posing a roadblock to this industry last year. increase over 2019.
The home décor market is expected to be valued at $202 billion by 2024, a 20% increase from 2019. Ecommerce accounted for 45% of Gap’s revenue in 2020, up from only 25% in 2019. s revenue in 2020, up from 33% in 2019. 30% of online orders were picked up in-store compared to 10% in 2019. increase over 2019.
Ecommerce accounted for 45% of Gap’s revenue in 2020, up from only 25% in 2019. s revenue in 2020, up from 33% in 2019. 30% of online orders were picked up in-store compared to 10% in 2019. US adult social media users spent 7 more minutes per day on social media in 2020 than 2019 – total of 82 minutes. Statista ).
US consumers spent an average 25 more minutes on mobile devices in 2020 vs. 2019 ( eMarketer ). That’s a 15% year-over-year increase , up from 6 hours and 49 minutes in 2019. 36% of consumers have experienced substantial shipping delays due to COVID-19 ( Narvar ). In 2019, ecommerce grew 14.6% Register here!
We organize all of the trending information in your field so you don't have to. Join 24,000+ users and stay up to date on the latest articles your peers are reading.
You know about us, now we want to get to know you!
Let's personalize your content
Let's get even more personalized
We recognize your account from another site in our network, please click 'Send Email' below to continue with verifying your account and setting a password.
.jpg
)


Let's personalize your content